X-Position
X-Position
Size
Annotation
Concentration
Lane
Center Color
Corrected Center Color
TLC Plate Title
Elutioplate is a web-app to analyze TLC (Thin-Layer Chromatography) plates, from images of them. Elutioplate is able to calculate RF (Retention Factor), intensity, color and more. The manual can be found here.
Elutioplate is developed by Victor Kyllesbech at Vrije Universiteit, and has been published as [Publication Title] in [Journal] in collaboration with [], detailing its use among chemistry students. Elutioplate is open-source and published under the [LICENSE] with code freely available on Github and Zenodo, If you want to contact me for Elutioplate-specific inquiries, please email elutioplate@kyll.dk
If you use Elutioplate in a context requiring citation, please cite our publication [Publication name and link] (DOI) as follows:
[Formatted Citation Here]
Elutioplate is provided as is, with all faults, Elutioplate provide no guarantee of results, use of elutioplate is at your own risk
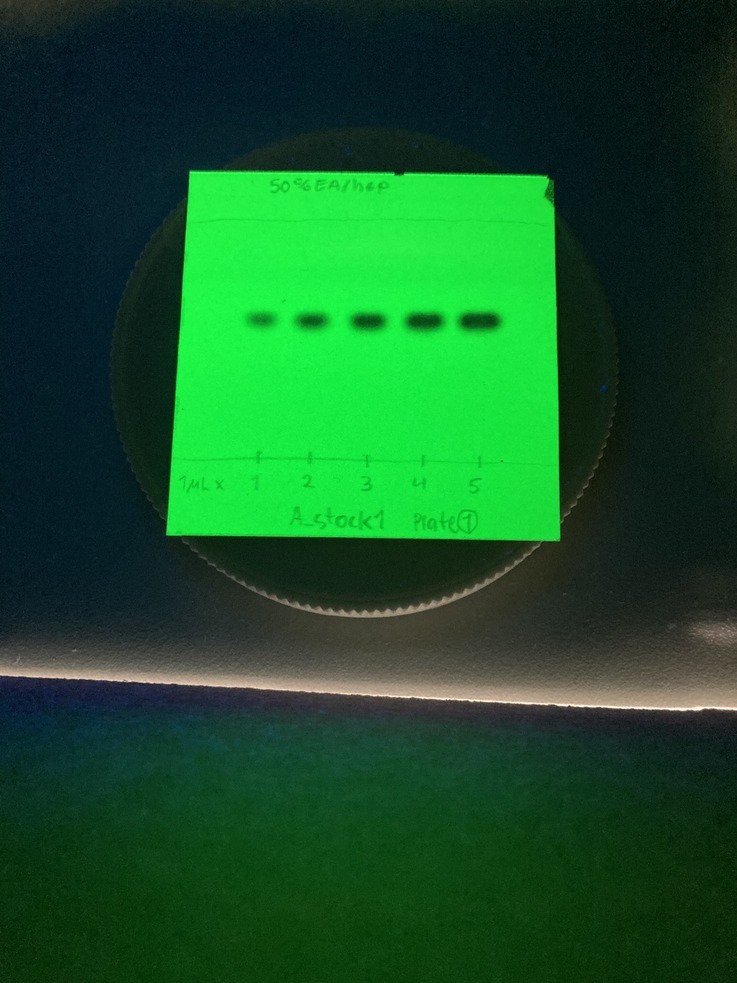
If you want to try out Elutioplate, you can download the Example TLC Plate used in the Manual here. This TLC plate contains various concentrations of N-Benzyl Benzamide, as listed in the table below. Using the intensity calculation, a linear relationship between concentration and intensity can be found.
| Spot | Concentration (µMol) |
|---|---|
| 1 | 0.02528 |
| 2 | 0.05055 |
| 3 | 0.07583 |
| 4 | 0.1011 |
| 5 | 0.1264 |
Another example TLC plate, is also available showing different colors, and retention factor values for different spots, this plate can be downloaded Here.
I'd like to extend a special thanks to Adrian G. Rossebø, who provided me with the idea for Elutioplate and, has been instrumental in the testing, and provided images of TLC plate for testing, including the example TLC plate used in the manual .
This project is build using OpenCV.JS using document scanner code adapted from Tony's tutorial and the simple-blob-detector by Jan Paul Posoma The dual-slider UI utilized is from Here, and code to limit text-input adapted from Here
Total Plate Height :
Main Section Height :
X-Position
X-Position
Size
Annotation
Concentration
Lane
Center Color
Corrected Center Color
Threshold Step : 5
Threshold : 25 - 220
Min Separation : 10
Repeatability : 2
Min Spot Area : 200
Min Circulairty : 0
Min Innertia : 0
Min Convexity : 0
Intensity
Threshold : 15
Expansion : 7
Color Sample Distance : 21
Correct sRGB Linearity
Advanced Export
| Spot ID | Lane | Image (+) |
Spot Pixels |
Background Source |
Background Estimation |
Adjusted Color |
Annotation | Retention Factor | Intensity (+) |
Intensity Map | Distance Intensity |
Distance Intensity Map |
Color Average (+) |
Adjusted Color Average |
Size (+) |
Size (Pixels) | Radius 1 | Radius 2 | Rotation | Concentration |
|---|
Save/Load Plot Theme
Which Blob To Edit
Preview Background Color
Use Correct Aspect Ratio
Line Width : 2
Padding : 25
Add TLC Image
Line Width : 2
Corner Radius : 10
Fill Color
Stroke Color
Draw Accurate Placement
Deposit Line : 0.1
Solvent Front : 0.9
Line Width : 2
Stroke Color
Draw Lines
Draw Accurate Placement
Line Width : 2
Stroke Color
Line Dash
Draw Text
Font Size : 8
Text Color
Text Offset : 0.05
ZigZag Offset : 0
Draw ZigZag Lines
ZigZag Line Width : 1
ZigZag Line Color
Which Spots To Edit
Center Radius : 8
Use Spots Base Color
Use Spots Adjusted Color
Circle Color
Which Spots To Edit
Annotation
Retention Factor
Size
Pixel Size
Intensity
Distance Intensity
Text Color
Angle : 0
Digit Precision : 2
Offset : 2
Font Size : 10
Draw Size
Line Color
Line Width : 1
Line Dash