To add a spot, click on the image where the spot is located, and a spot will be added. The spot will be marked with a circle.
Elutioplate Manual
Title-Bar
Help-Function
To get help, click the "?" icon in the top right corner. When your cursor displays a "?" next to it, click on the element you need help with and a pop-up will show relevant information.
You can also find the manual at elutioplate.com/manual.
Theme Selector
You can change the theme of Elutioplate in the Theme-Dropdown menue in the top bar
Home
Home Page
The home-page is where you will select the image of the TLC plate you want to analyze, and optionally give it a title.
Selecting An Image
Click on "Click here to upload a picture" and select the image of a TLC plate you wish to analyze. Supported image types are JPG/JPEG, PNG, BMP, WEBP, and GIF.
TLC Plate Name
Enter a title for the TLC plate.
Next-Button
Once the image is uploaded, and the TLC plate name is set, click on the "Next" button to go to Transform page.
Transform Page
Transform Page
On the Transform page, you can rotate the image of the TLC plate and select its corners to correct for perspective distortion.
Rotate Image
The uploaded image can be rotated 90° by pressing the rotate button
Corner Selection
Once an image is selected, align the 4 corners so they match the corners of the TLC plate. If the plate is cut or narrowed at the bottom—forming a trapezoidal shape—place the corners where the full rectangular shape would have extended before the cut.
Lanes Page
Lanes Page
On the Lanes page, you can click on the image to set where each lane is—that is, where each sample was deposited.
Adding Lanes
Click on the image to add a lane. You can adjust the position by clicking and dragging the selected lane. You can remove a lane by clicking the trash can icon.
Lanes
Lane Index
Each lane has a unique number, this is the lane index, shown here.

Lane Annotation
You can give each lane a name or title. This is called the lane annotation and is useful for keeping track of what sample or experiment has been deposited on the lane.
Lane Delete Button
To delete a lane, you can press the trash can icon, or select the lane and press the Backspace or Delete key.
Next Button
Once all lanes have been added, click "Next" to continue to the baseline page.

Baselines Page
Baseline Page
On the Baseline page, you can set the position of the sample deposition line and the solvent front on the image of the TLC plate.
Set Baselines
Using the slider on the left, align the overlaid lines so the bottom line matches your deposition marking and the top line matches your solvent front
Plate Height
The height of the plate can be set using the "Total Plate Height" (e.g., if the plate is 2 cm tall), or by setting the height of the main section (from the deposition line to the solvent front). Since these are connected, changing one will update the other.
These values do not affect the calculation of Rf or intensity, but are used to calculate travel length. If this is not needed, the main section height can be left at 100.
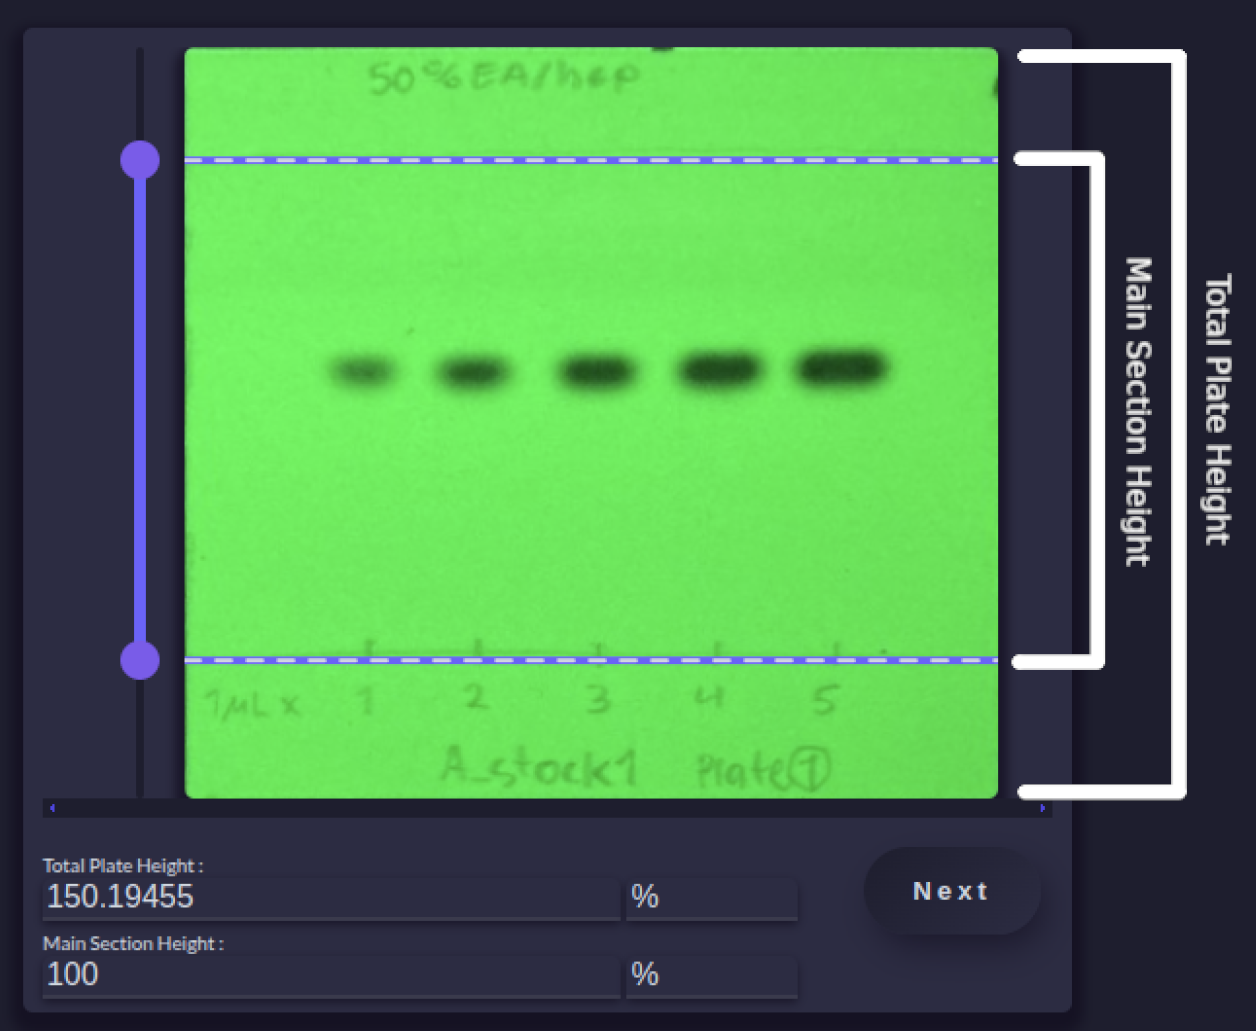
Plate Height Units
This is the unit of the plate height. It does not affect calculations, but can be useful for keeping track of the actual height of the plate. The unit is the same for both main and total height.
Spots Page
Spot Page
The Spots page is where you can mark each spot on the TLC plate. This can be done automatically using the Spot Autodetect button, or manually.
To manually add a spot, click on the image where the spot is located. This will add a spot marked with a circle. To remove a spot, press Backspace.
Adding & Editing Spots
Add a spot
Delete a spot
To delete a spot, click on the center of the spot, then either press the Backspace or Delete key, or click the delete button on the left under "Spot Properties".
To delete all spots, click the "Clear" button on the left under "Spot Properties".
Change Spot Size
To change the size of a spot, click on the center of the spot and use the mouse scroll wheel.
Alternatively, click on the center of the spot and use the + or ↑ keys to increase the size, and the - or ↓ keys to decrease it.
Change Spot Width
To change the width of a spot, click on one of the small circles on the edge of the spot (note the arrow icon when hovering over it), and drag the mouse closer to or further from the center to adjust the width.
Rotate a Spot
To rotate a spot, click on one of the large circles on the edge of the spot (note the "rotate" icon when hovering over it), and drag the mouse around the center of the spot to rotate it.
Spot Properties
X Position
The X Coordinate of the Spot
Y Position
The Y Coordinate of the Spot
Size
The area of the selection around the spot
Annotation
Set a title or annotation for each spot to help keep track of what each spot is.
Lanes
Here you can set which lane the spot should be considered part of.
Delete Spot Button
Click this button to delete the selected spot.
Clear Spots Button
Click this button to delete all spots on the plate.
Spot Autodetect
Spots on the plate can be automatically detected by pressing the "Run Spot-Detect" button. This will run a spot detection algorithm and display the detected spots on the image.
There are several parameters that can be adjusted to modify the detection algorithm. These parameters are explained below.
Note that the shape of the spots is not detected — the algorithm sets all spots as perfect circles.
Threshold
The spot detector analyzes grayscale images to find spots. Using a threshold value, it attempts to detect the edges of the spots. A single threshold may not be sufficient to find all spots, so the detector checks multiple threshold values.
The minimum and maximum threshold values can be set using the threshold sliders. The number of threshold values checked within this range can be adjusted using the threshold steps slider.
Minimum Separation
Minimum separation is the minimum distance between two spots for them to be considered distinct. If the distance is less than this value, the two spots will be treated as a single spot.
Minimum Repeatability
The detection algorithm checks the same image multiple times using different threshold values. The repeatability value is the minimum number of times a spot must be detected for it to be considered a unique spot.
Minimum Size
The minimum spot area is the smallest size a spot is allowed to be. Anything smaller will be ignored as background noise.
Minimum Circularity
Circularity is a measure of how circular a spot is (i.e., how close it is to a perfect circle). The minimum circularity value is the lowest value a spot can have to be considered valid. This can be used to filter out irregularly shaped spots or remove noise from the image. The value ranges from 0 to 1, with 1 representing a perfect circle.
Minimum Inertia
Inertia is a measure of how stretched out a spot is. The minimum inertia value is the lowest value a spot can have to be considered valid. This can be used to remove elongated markings on the TLC plate and reduce noise. The value ranges from 0 to 1, with 1 representing a perfect circle and 0 representing a straight line.
Minimum Convexity
Convexity is a measure of how indented a shape is—how much it bends inward. The minimum convexity value is the lowest value a spot can have to be considered valid. This can be used to filter out irregularly shaped spots or remove noise from the image. The value ranges from 0 to 1, with 1 representing a perfect circle (no indentations).
Intensity & Threshold
Calculate Intensity
Once a threshold is selected, click "Calculate" to compute the intensity of the spots. After calculation, click "Show" to see which pixels were detected. If not all of the pixels that make up your spot are detected, or if too large an area is selected, the threshold needs to be adjusted.
Show Intensity
After the intensity is calculated, the "Show" button will highlight the parts of the image used in the calculation.
The highlighted area should cover the entire spot without including too much extra space. If the highlighted area is cut off by the ellipse or circle, increase its size to fully enclose the spot. The highlighted area depends on the threshold setting — lower thresholds select a larger area, while higher thresholds select a smaller one.
Set Threshold
The threshold determines which pixels are used to calculate the intensity of the spot. It is set using the "Threshold" slider, and the current value is shown in the text box. You can click "Estimate Intensity" to set the threshold to a rough estimate what should be an appropriate threshold
The threshold should be selected so that the entire spot is highlighted, but without including too much extra area.
Once the threshold is set, click "Calculate" to compute the intensity, then click "Show" to see which pixels were highlighted and check if the threshold is appropriate.
Estimate Threshold
The "Estimate" button can be used to calculate a rough estimate of an appropriate threshold value. Be aware that this value might not be optimal for the calculation, but it serves as a useful starting point.
Selection Expansion
The identified pixels can often be a bit sparse. To allow for a more accurate intensity calculation, the pixels within a certain radius around each detected pixel are also included. This helps prevent "holes" in the selection and allows weak edges to be captured.
The selection expansion value sets how far from each detected pixel surrounding pixels are included. This can be adjusted using the "Selection Expansion" slider.
Color Sampling Dist
To get an accurate intensity value, the color "behind" the spots needs to be estimated.
This allows for correction of uneven lighting and similar issues. The calculation of color
is done by taking color from around the spot and interpolating the color of the spot.
The color sampling distance, is how far away to sample colors from, the length should be
set far enough that there are enough color to sample from, but not so far it begins sampling
from an area where there might be a scratch or marking on the plate.
Where color is sampled from can be seen under "images" on the results page, together with
what the color of the TLC plate, where the spot is, is estimated as, if the spot wasnt there.
Results Page
Results Page
On the Results page, you can view a table summarizing the TLC plate analysis, estimate concentrations, and download the data.
Results Table
Spot ID Column
A unique number assigned to each spot on the TLC plate.
Lane Column
Indicates which lane each spot is considered part of and shows the annotation assigned to that lane on the "Lanes" page.
Image Column
The area of the TLC plate within the ellipse selection around the spot.
(Image) Spot Pixel Column
The pixels within the ellipse selection that were detected as part of the spot. This depends on the threshold set on the "Spots" page.
(Image) Background Source Column
To estimate what the color of the plate would be if the spot weren’t there, color from around the spot is used. The image shown highlights the area from which the algorithm samples background color information for this estimation. This area should contain only background color. Its size can be adjusted using the "Color Sample Distance" setting on the "Spots" page.
(Image) Background Estimation
This image shows the color Elutioplate estimates the spot area would have if the spot were not present. In most cases, this should be a uniform color. The result depends on the "Color Sample Distance" set on the "Spots" page.
(Image) Adjusted Background Color
This is the same as the Background Estimation, but where the colors have been altered, to assume the TLC plate is white. If this is used with green fluorescent plates, it´s generally not useful, as it will alter colors to be pink.
Annotation
This is the same as the Background Estimation, but with colors adjusted to assume the TLC plate is white. When used with green fluorescent plates, this is generally not useful, as it will shift the colors toward pink.
Retention Factor
The calculated retention factor (Rf value) of each spot.
Intensity
The estimated intensity of each spot, based on how light or dark the spot is. The uncertainty is estimated from the noise present in the background source—the area around each spot that Elutioplate uses to estimate the TLC plate's color if the spot were not present.
(Intensity) Intensity Map
An image showing how much each pixel in the selection contributes to the overall intensity—in other words, how intense each pixel is.
(Intensity) Distance Intensity
An alternative method for measuring intensity, where intensity is based on how different the spot's color is from the estimated background color. This may provide better results in some cases, especially with differently colored compounds.
(Intensity) Distance Intensity Map
How much each pixel contributes to the distance-based intensity—in other words, how different the color is from the estimated background color.
Color Average
The bottom shows the average color along with its HEX code. The top shows a gradient of the different colors present within the spot.

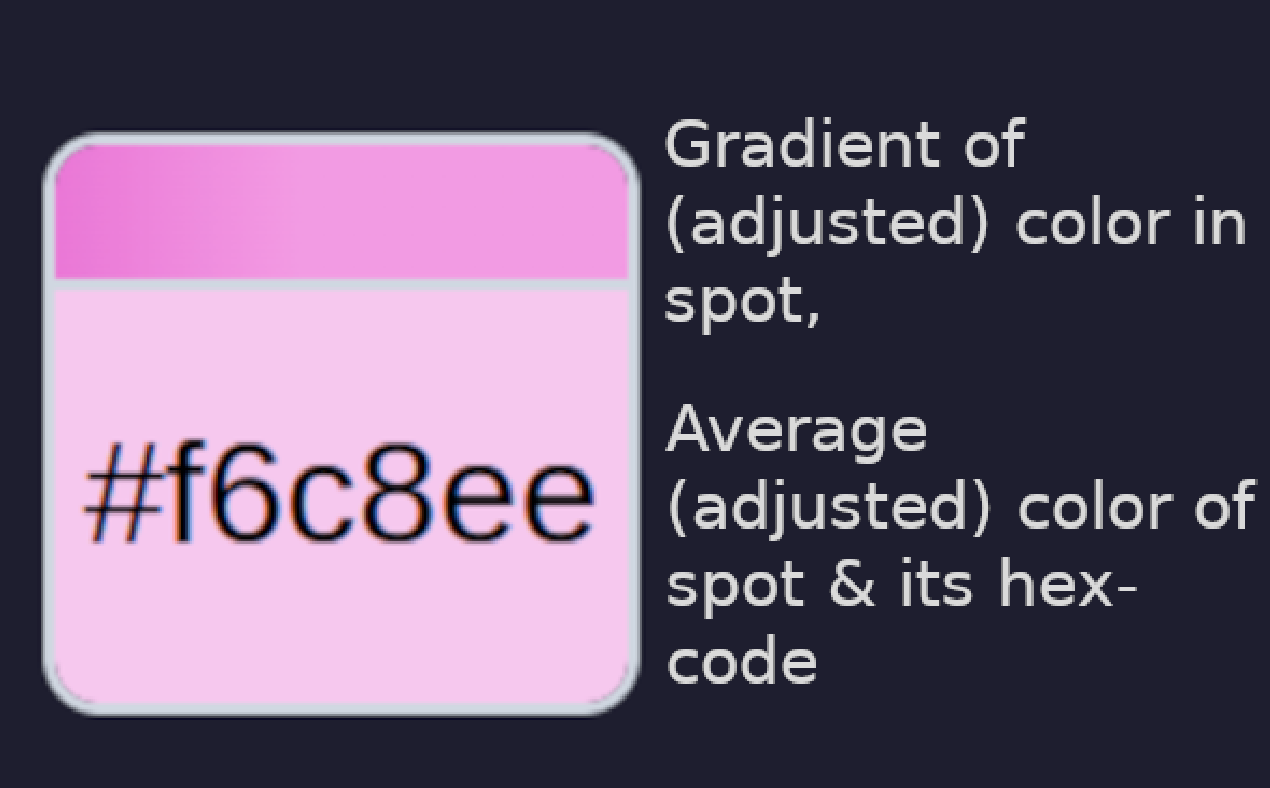
Adjusted Color Average
The bottom shows the average color, adjusted to assume a white TLC plate, along with its HEX code. The top displays a gradient of the different colors present within the spot, also adjusted for a white background.
Size
The size of the ellipse selection, calculated from the height and width of the ellipse drawn around each spot on the Spots page.
(Size) Size (Pixels)
The number of pixels identified as part of the spot, based on the selected threshold.
(Size) Radius 1
The height and width of the ellipse drawn around each spot.
(Size) Radius 2
The height and width of the ellipse selected around each spot.
(Size) Rotation
If the spot has been rotated, this shows the amount of rotation.
Concentration
By entering two or more known concentrations, Elutioplate will estimate the concentration of other spots based on their intensity. For accurate uncertainty estimation, at least three known concentrations are recommended.
To remove a concentration value, simply delete it—Elutioplate will then treat it as a predicted value. If you modify a predicted value, it will be treated as a measured value, and the "predicted" tag will disappear.
Download Options
Export HTML
Download the results table as a formatted HTML file, including images and color formatting.
Export CSV
Download the results table as a CSV file. This will not include images or other formatting.
Export JSON
Download all information about the TLC plate as a JSON file. This is mainly useful for advanced users or for sharing with the Elutioplate developers to help improve the software if you encounter a problem or bug.
Export Text
Export the results table as a simple text file. This will not include images or formatting.
Copy Text Export
Creates a plain-text version of the results table and copies it to the clipboard. This will not include formatting or images.
Advanced Download
If this checkbox is checked, the downloaded CSV, HTML, or TXT file will contain more detailed tables with additional information. If unchecked, the output will be simplified to only the most essential data.
Export Figure Page
Figure Export Page
On the figure-export page you can generate beautiful figures of your TLC plate, ready for a report or presentation.
General Options
Save Drawing Settings
Save the current figure-drawing settings to a file so they can be loaded later and reused.
Load Drawing Settings
Load a previously saved settings file with figure-drawing settings to quickly reapply all changes.
Theme Dropdown
Select from a list of predefined themes for figure drawing.
Image Preview Background
The background color of the preview page. This does not affect the final figure.
Use Accurate Aspect Ratio
This ensures that the aspect ratio of the plate matches the original image.
Aspect Ratio
This sets how wide the figure is, unless "Use correct aspect ratio" is enabled.
Padding
This sets how much padding surrounds the figure—empty space on all sides.
Add TLC Image
This adds an image of the TLC plate behind the figure. Note that SVG output will not work with this enabled. Furthermore, if the aspect ratio is not accurate, it may lead to distorted results.
Outline Options
Outline Width
Sets the thickness of the TLC plate outline.
Corner Radius
Sets how much rounding is applied to the corners of the TLC plate.
Fill Color
Sets the background color of the figure, specified as a hex code (e.g., #FF0000 for red).
Stroke Color
Sets the color of the figure's outline, specified as a hex code (e.g., #FF0000 for red).
Baseline Options
Draw Accurate Placement
Draws the baselines in their correct positions, as they are placed on the TLC plate.
Deposition Line Placement
Sets the position of the deposition line (has no effect if accurate placement is enabled).
Solvent Front Placement
Sets the position of the solvent front line (has no effect if accurate placement is enabled).
Baseline Line Width
Sets the width of the deposition and solvent front lines.
Baseline Stroke Color
Sets the color of the deposition and solvent front lines, specified as a hex code (e.g., #FF0000 for red).
Lane Options
Draw Lanes
Whether or not to draw each lane.
Draw Lanes Accurate Position
Draws lanes in their correct positions, as they are placed on the TLC plate. If disabled, lanes will be drawn equidistant from each other.
Lane Stroke Color
Sets the color of the lanes, specified as a hex code (e.g., #FF0000 for red).
Lane Stroke Dash
Sets the dash pattern of the lane lines. This is a list of numbers where the first number is the length of the dash, and the second is the length of the space between dashes.
For example, [5, 5] will create a dashed line with 5px dashes and 5px spaces.
[5, 2, 1, 2] will create a pattern of 5px dashes, 2px spaces, 1px dashes, and 2px spaces.
Draw Lane Text
Whether or not to add lane annotations to the figure.
Lane Text Font Size
Sets the font size used for lane annotations.
Lane Text Offset
Sets the distance between the lane line and its annotation.
Lane Text ZigZag Offset
Zigzag offset: lowers the text of every other lane to help avoid overlapping annotations when labels are too long.
Draw ZigZag Lines
When enabled, draws a short line connecting to the zigzagged lane annotation, if Zigzag Offset is on.
Draw ZigZag Line Stroke Width
Sets the width of the zigzag line when it is enabled.
Draw ZigZag Line Stroke Color
Sets the color of the zigzag line, specified as a hex code (e.g., #FF0000 for red), when the zigzag line is enabled.
No help text has been implemented for this part of the page yet.